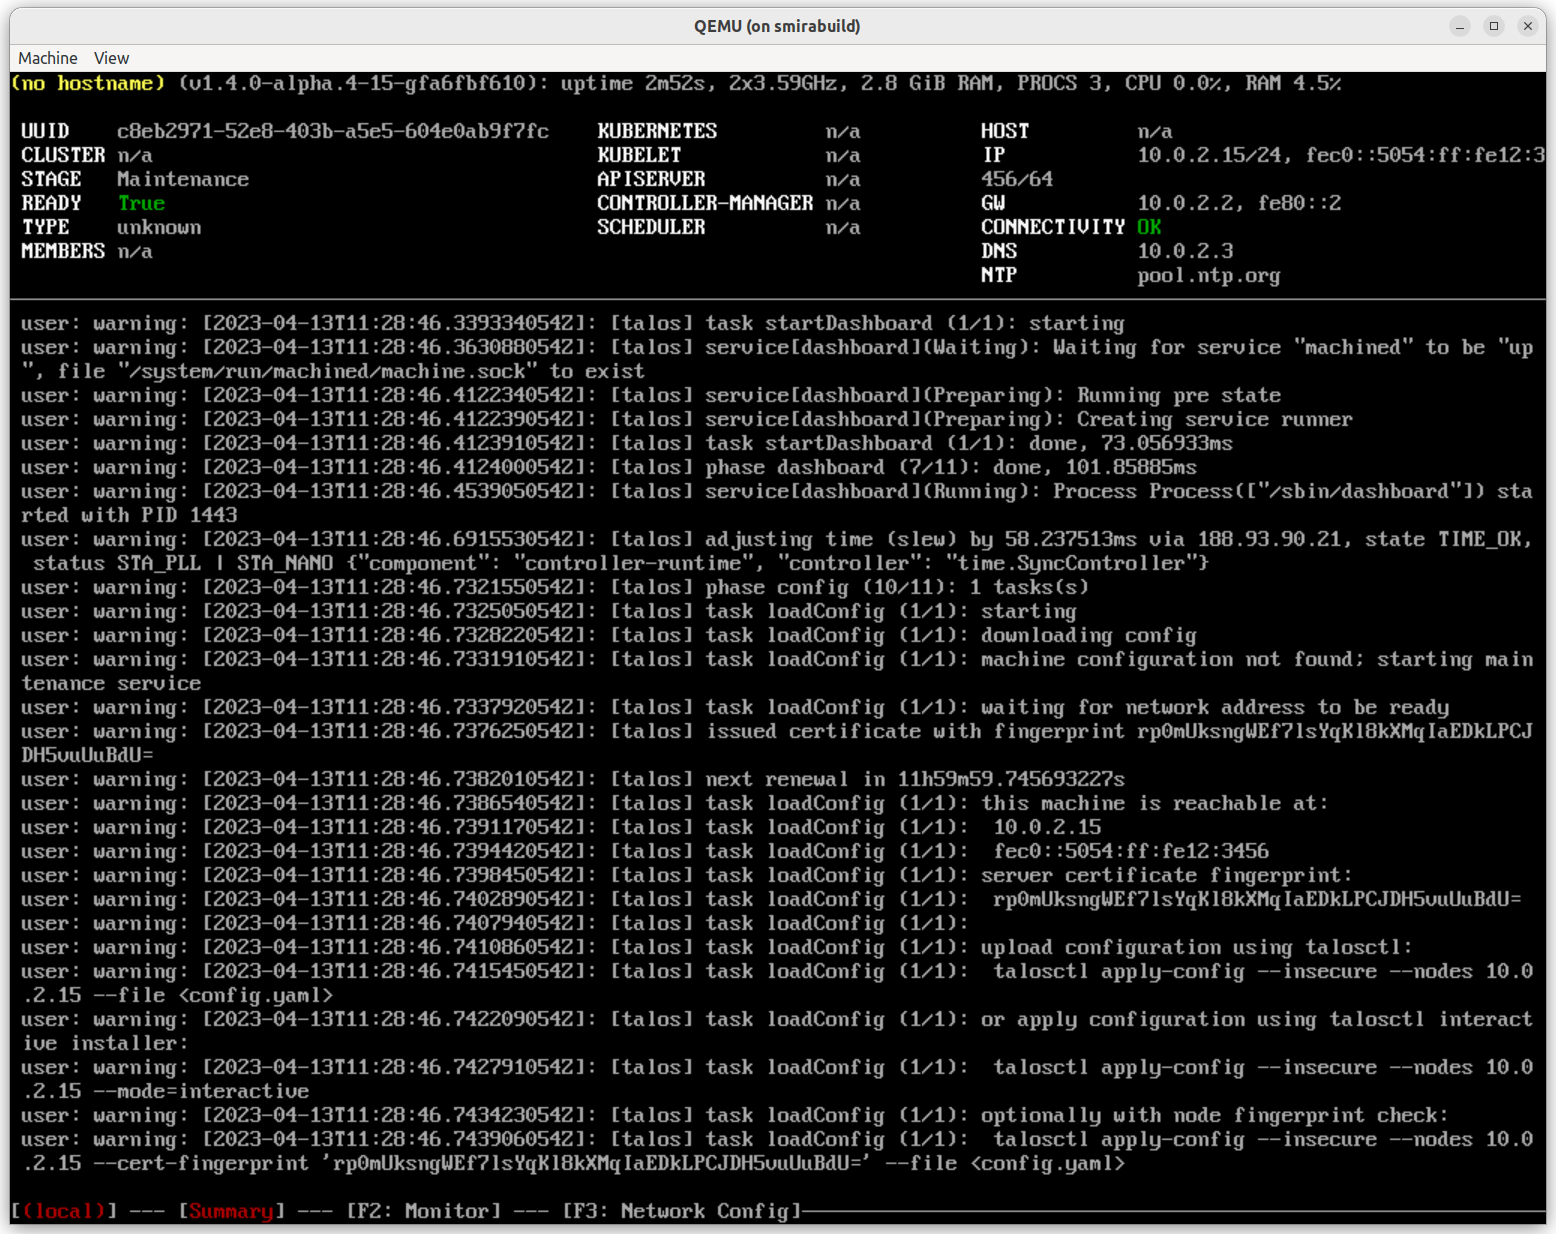
 The header shows brief information about the node:
* hostname
* Talos version
* uptime
* CPU and memory hardware information
* CPU and memory load, number of processes
Table view presents summary information about the machine:
* UUID (from SMBIOS data)
* Cluster name (when the machine config is available)
* Machine stage: `Installing`, `Upgrading`, `Booting`, `Maintenance`, `Running`, `Rebooting`, `Shutting down`, etc.
* Machine stage readiness: checks Talos service status, static pod status, etc. (for `Running` stage)
* Machine type: controlplane/worker
* Number of members discovered in the cluster
* Kubernetes version
* Status of Kubernetes components: `kubelet` and Kubernetes controlplane components (only on `controlplane` machines)
* Network information: Hostname, Addresses, Gateway, Connectivity, DNS and NTP servers
Bottom part of the screen shows kernel logs, same as on the virtual TTY 1.
## Monitor screen (`F2`)
The header shows brief information about the node:
* hostname
* Talos version
* uptime
* CPU and memory hardware information
* CPU and memory load, number of processes
Table view presents summary information about the machine:
* UUID (from SMBIOS data)
* Cluster name (when the machine config is available)
* Machine stage: `Installing`, `Upgrading`, `Booting`, `Maintenance`, `Running`, `Rebooting`, `Shutting down`, etc.
* Machine stage readiness: checks Talos service status, static pod status, etc. (for `Running` stage)
* Machine type: controlplane/worker
* Number of members discovered in the cluster
* Kubernetes version
* Status of Kubernetes components: `kubelet` and Kubernetes controlplane components (only on `controlplane` machines)
* Network information: Hostname, Addresses, Gateway, Connectivity, DNS and NTP servers
Bottom part of the screen shows kernel logs, same as on the virtual TTY 1.
## Monitor screen (`F2`)
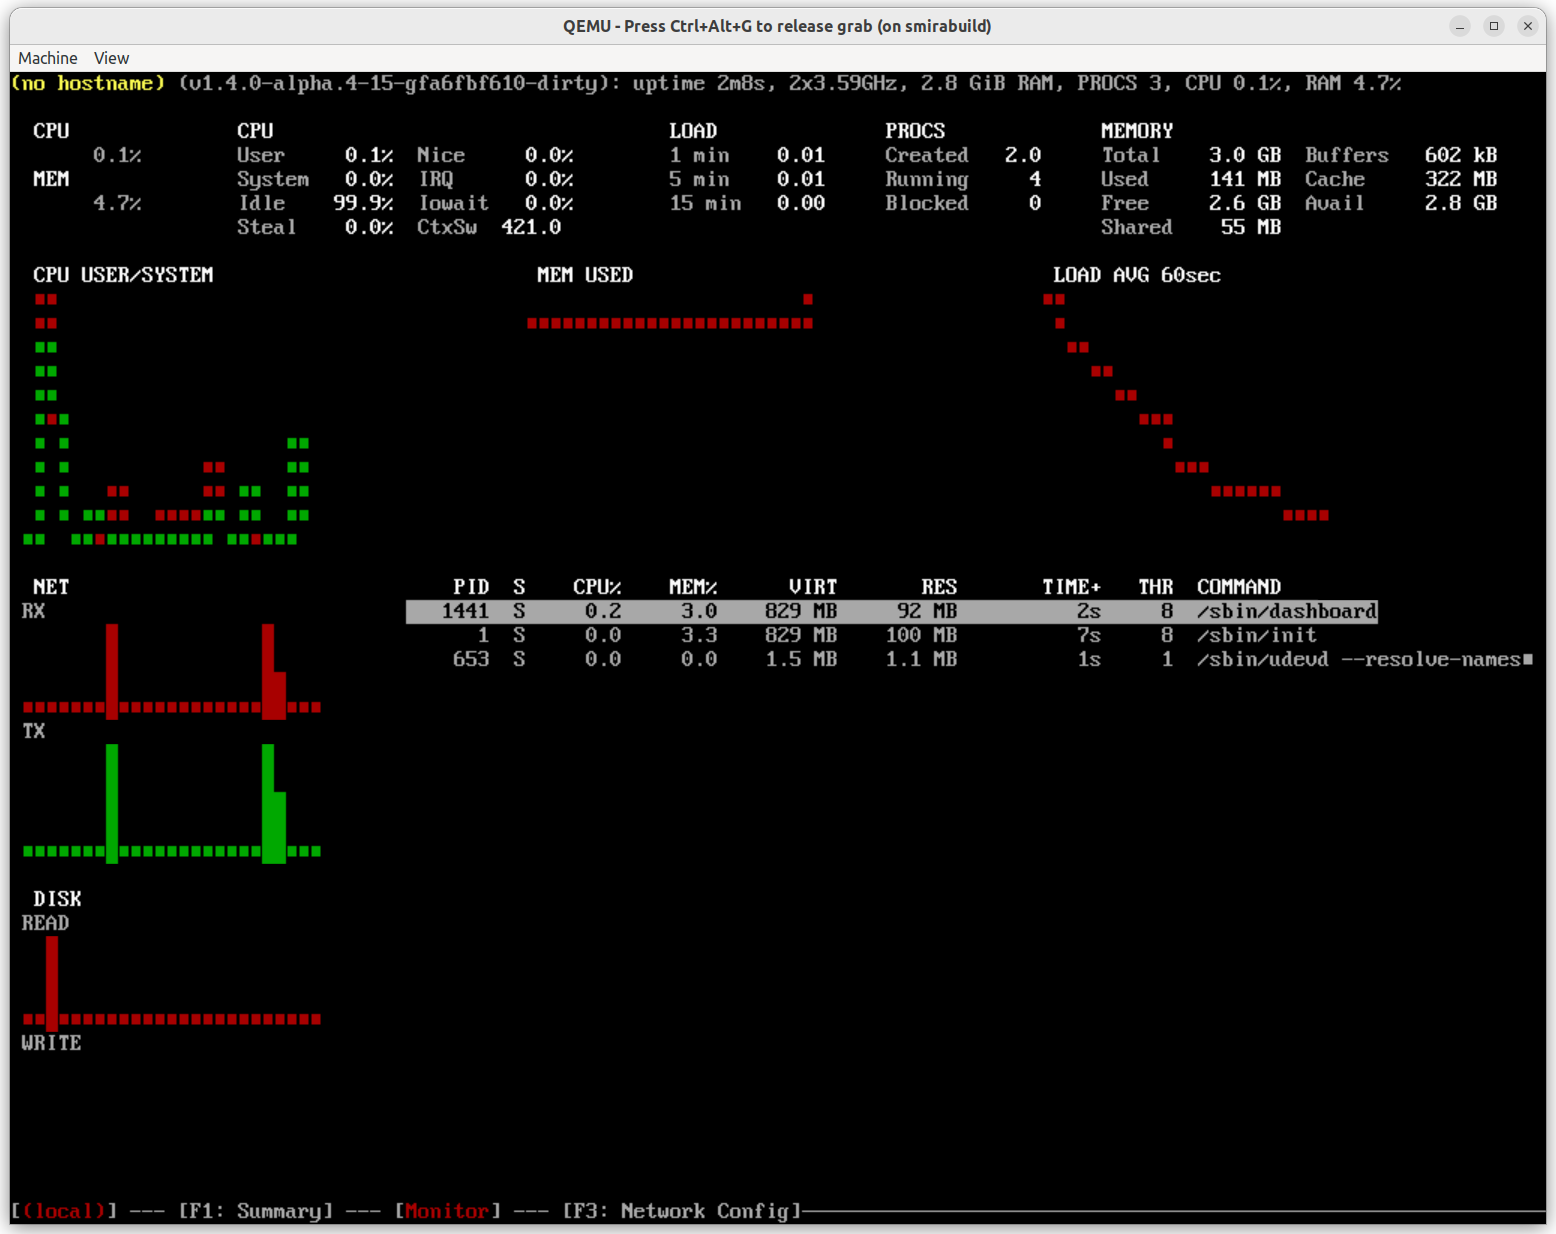 Monitor screen provides live view of the machine resource usage: CPU, memory, disk, network and processes.
## Network config screen (`F3`)
> Note: network config screen is only available for `metal` platform.
Monitor screen provides live view of the machine resource usage: CPU, memory, disk, network and processes.
## Network config screen (`F3`)
> Note: network config screen is only available for `metal` platform.
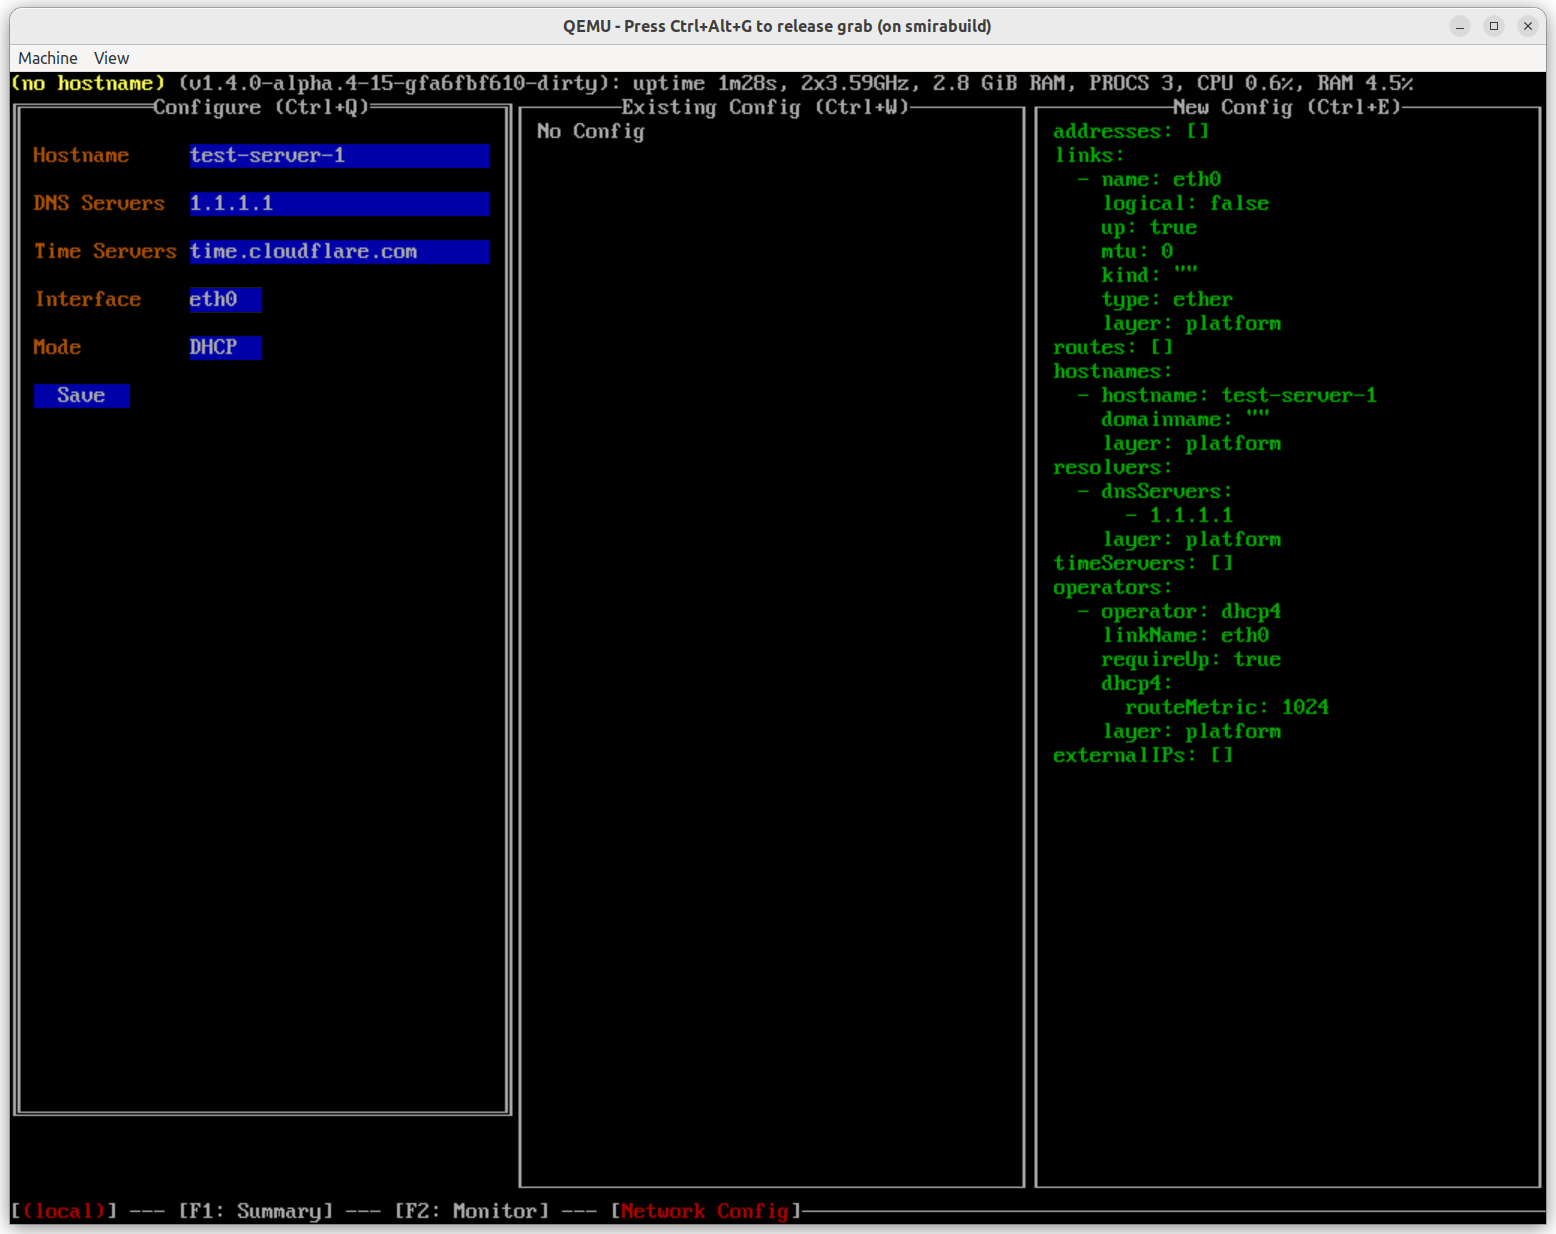 Network config screen provides editing capabilities for the `metal` [platform network configuration](../platform-specific-installations/bare-metal-platforms/network-config).
The screen is split into three sections:
* the leftmost section provides a way to enter network configuration: hostname, DNS and NTP servers, configure the network interface either via DHCP or static IP address, etc.
* the middle section shows the current network configuration.
* the rightmost section shows the network configuration which will be applied after pressing "Save" button.
Once the platform network configuration is saved, it is immediately applied to the machine.
## Resource Viewer (`F4`/`F3`)
Network config screen provides editing capabilities for the `metal` [platform network configuration](../platform-specific-installations/bare-metal-platforms/network-config).
The screen is split into three sections:
* the leftmost section provides a way to enter network configuration: hostname, DNS and NTP servers, configure the network interface either via DHCP or static IP address, etc.
* the middle section shows the current network configuration.
* the rightmost section shows the network configuration which will be applied after pressing "Save" button.
Once the platform network configuration is saved, it is immediately applied to the machine.
## Resource Viewer (`F4`/`F3`)
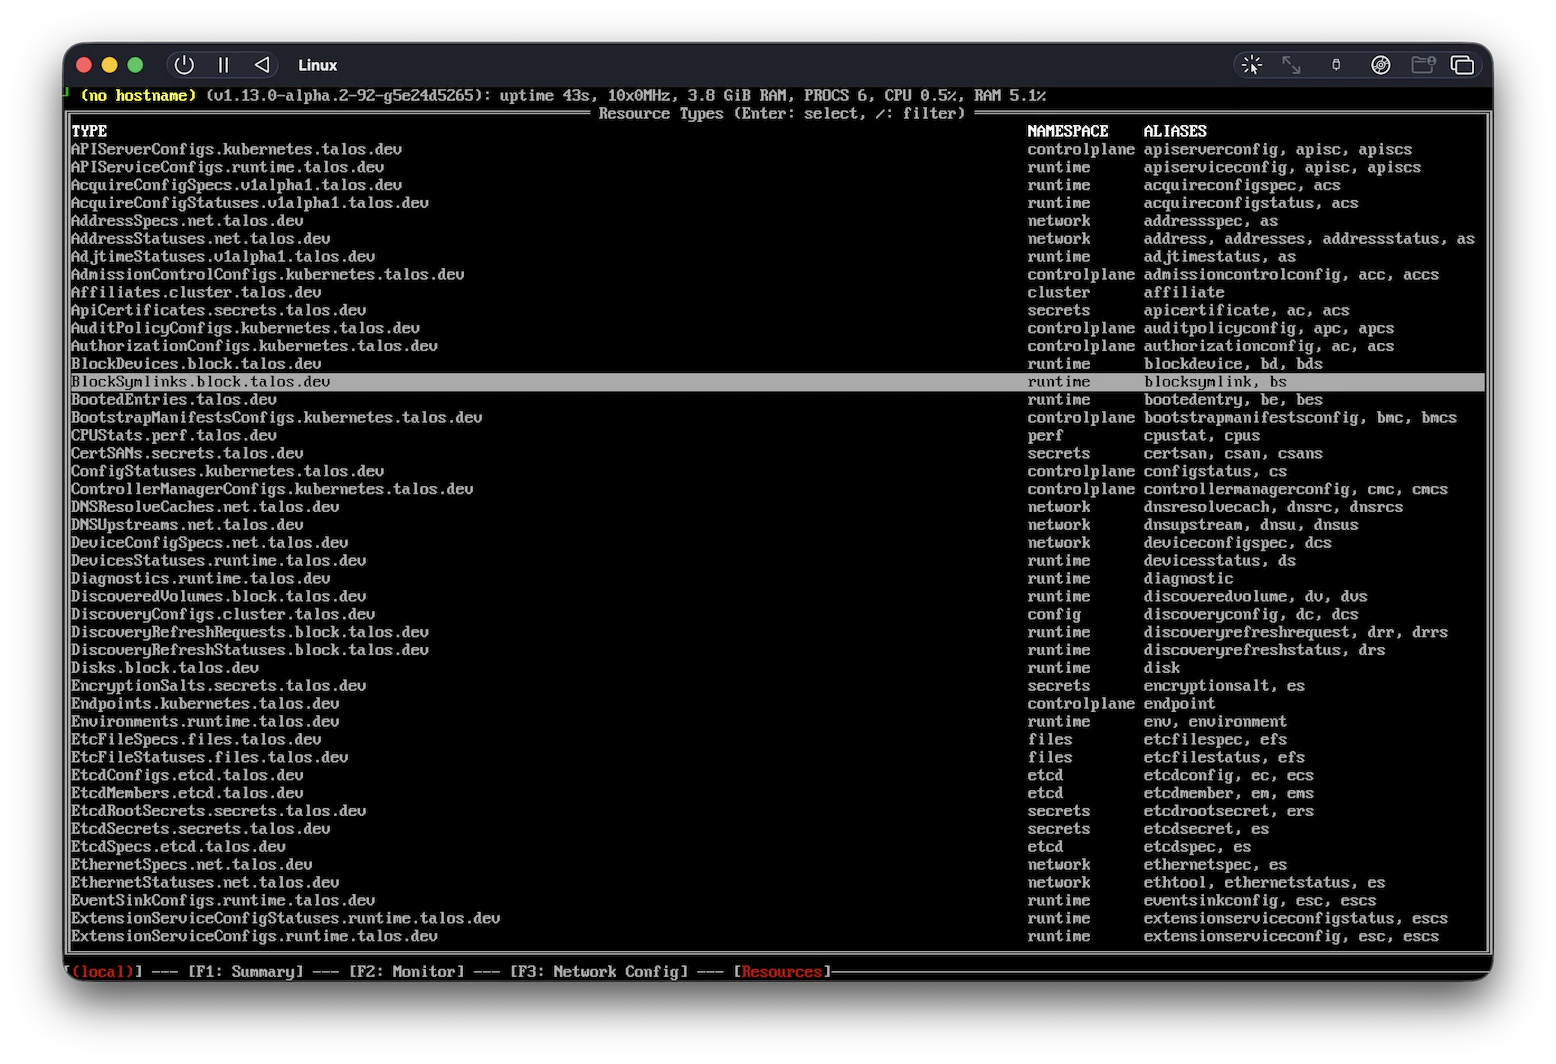 Resource viewer screen provides a way to inspect the running Talos machine state when using the video console is the only option (e.g. when the network is not working and `talosctl` cannot be used).
When using the console, only non-sensitive resources are available, while when using `talosctl dashboard` command, available resources depend on the RBAC permissions of the user.
Resource viewer can be used to inspect network links, hardware devices, disks, etc.
The list of resources can be filtered by pressing `/` key and entering the search query. Use `/` to clear or change the filter.
Pressing `Enter` on a resource type shows a list of available resources of this type, and pressing `Enter` on a specific resource shows detailed information about it in YAML format.
Resource viewer screen provides a way to inspect the running Talos machine state when using the video console is the only option (e.g. when the network is not working and `talosctl` cannot be used).
When using the console, only non-sensitive resources are available, while when using `talosctl dashboard` command, available resources depend on the RBAC permissions of the user.
Resource viewer can be used to inspect network links, hardware devices, disks, etc.
The list of resources can be filtered by pressing `/` key and entering the search query. Use `/` to clear or change the filter.
Pressing `Enter` on a resource type shows a list of available resources of this type, and pressing `Enter` on a specific resource shows detailed information about it in YAML format.