> ## Documentation Index
> Fetch the complete documentation index at: https://docs.siderolabs.com/llms.txt
> Use this file to discover all available pages before exploring further.
# Hosts
> Add hypervisor hosts, view their health and capacity in the Hosts view, inspect a host's hardware, workloads, services, and logs from the host detail screen, and reboot, power off, or put hosts into maintenance mode.
Talos Director is in Limited Availability. Limited Availability customers receive full production support and work directly with Sidero Labs engineering during onboarding. General availability is planned for January 2027, and the console is changing quickly until then, so details on these pages may differ from what you see.
To request access, visit [siderolabs.com/getdirector](https://www.siderolabs.com/getdirector).
A host is the physical server that runs virtual machines in Talos Director. It supplies the CPU, memory, storage, and network interfaces, and runs Talos Linux with the KVM hypervisor. Hosts are the execution layer underneath every VM and Kubernetes node, so the **Hosts** pages are where you confirm that layer is healthy before a problem surfaces as a VM or Kubernetes symptom.
Hosts usually belong to a [cluster](/director/compute/clusters), which sets the boundary for VM placement, load balancing, and High Availability (HA).
## The Hosts view
Navigate to **Compute** > **Hosts** > **All Hosts** to see every host in one table.
### Columns
The table shows the following columns.
| **Column** | **Description** |
| - | - |
| **Hostname** | The host's DNS name or FQDN. Click it to open the host detail screen. |
| **Cluster** | The cluster the host belongs to. The cluster is the placement, load-balancing, and HA boundary for the host's VMs. |
| **Status** | The host's connection and health state, for example `Connected`. Hover over the status to see more detail. |
| **Agent Version** | The version of the Talos Director agent running on the host. |
| **CPU Usage** | Current CPU usage on the host, as a percentage. |
| **Memory Usage** | Current memory usage on the host, as a percentage. |
| **VMs** | The number of virtual machines on the host. |
| **Uptime** | How long the host has been running since its last boot. |
| **Actions** | The row-level menu for host operations. See [Row actions](#row-actions). |
Select **Columns** to show additional columns, such as **Platform**, **OS Version**, and **BIOS Version**, and to reorder the columns.
### Controls
The controls above the table let you search, shape, and export the view:
* **Filter hosts...**: filter the table with free text or query-style expressions, for example `status:connected`.
* **Columns**: choose which columns are visible and in what order.
* **Export CSV**: download the current view for reporting or offline analysis.
* **Add Host**: register and deploy a new hypervisor host. See [Add a host](#add-a-host).
### Row actions
The **Actions** menu on each row offers the following:
* **Edit**: opens the host detail screen. See [The host detail screen](#the-host-detail-screen).
* **Move to Folder**: moves the host to a different folder in the inventory.
* **Enter Maintenance Mode**: takes the host out of service. See [Manage hosts](#manage-hosts).
## Add a host
Adding a host has two stages. First you register the host in Talos Director, which creates its record in the inventory. Then you run a deployment script on the physical server, which installs Talos onto it and connects it to that record.
Registering a host does not create any virtual machines or Kubernetes nodes. It establishes the host as a trusted, managed resource that workloads can later be placed on.
### Register the host
1. Navigate to **Compute** > **Hosts** > **All Hosts**.
2. Select **+ Add Host**. The **Add Host** screen opens on the **Host Configuration** step.
3. Under **Host Information**, complete the following fields:
* **Hostname (FQDN)**: the server's fully qualified domain name.
* **IP Address**: the server's IP address.
* **Cluster**: the cluster the host joins, or **Standalone (No Cluster)**.
* **SSH Port**: the server's SSH port.
4. Under **Agent & Security**, choose the following options:
* **Enable Monitoring Agent**: installs an agent that collects metrics, monitors events, and enables automatic High Availability.
* **Generate TLS Certificate**: generates a TLS certificate for mutual TLS (mTLS) between the host's agent and Talos Director.
5. Select **Register Host**. Talos Director validates the fields, adds the host to the inventory, and moves to the **Deployment** step.
### Deploy the host
The deployment script reprovisions the server and can overwrite its installation disk. Before you run it, confirm that you are on the intended machine and that its host, disk, and network settings are correct.
1. On the **Deployment** step, copy the **Deployment Script**.
2. Start the physical server that will become the host in a supported deployment or live Linux environment. The server must be able to reach Talos Director over the network.
3. Run the script on that server, not on the Talos Director server. You can run it from any of the following:
* A directly connected keyboard and monitor.
* The server's remote-management console, such as iDRAC, iLO, or IPMI.
* A remote shell, if the live environment provides one.
The script downloads the deployment information, associates the server with the host record you registered, and installs Talos onto the selected disk. When the server reboots and connects back to Talos Director, its status in **All Hosts** changes to `Connected`.
4. To change the host's settings afterward, open the **Actions** menu on its row in **All Hosts** and select **Edit**.
## Manage hosts
To act on one or more hosts at once, select their check boxes in the **Hosts** view. A bar appears above the table showing how many hosts are selected and how many VMs are running on them, with the following actions:
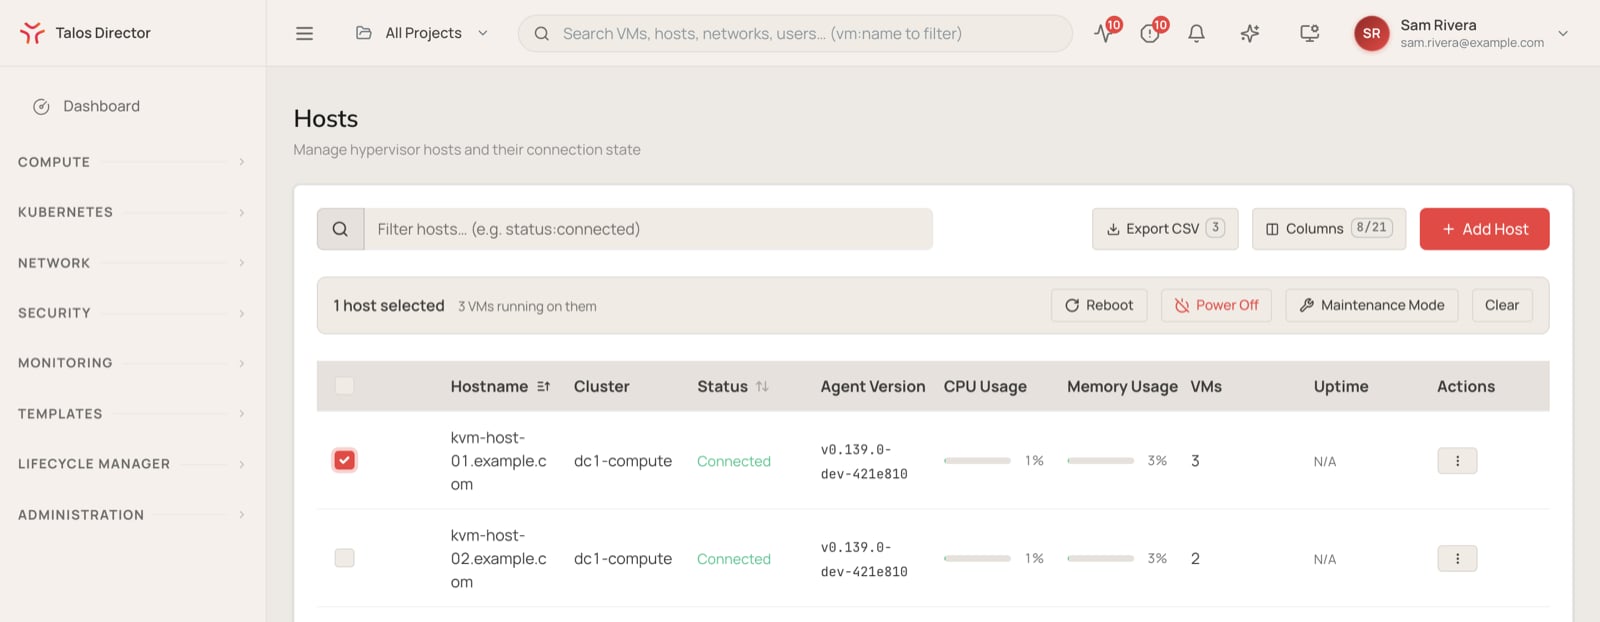 * **Reboot**: reboots the selected hosts.
* **Power Off**: powers down the selected hosts.
* **Maintenance Mode**: puts the selected hosts into maintenance mode. The dialog that opens lets you live-migrate the hosts' VMs to other hosts in the cluster before maintenance mode begins.
* **Clear**: clears the selection.
Rebooting or powering off a host stops every VM running on it. To keep workloads running, put the host into maintenance mode and migrate its VMs first, and confirm the remaining hosts in the cluster have the capacity to take them.
## The host detail screen
Click a hostname to open its detail screen. Tabs separate each aspect of the host.
### Overview
High-level information about the host, including CPU and memory usage and system information.
### Virtual Machines
The virtual machines on the host, with each VM's power state, CPU count, and total capacity. From the **Actions** column you can power a VM on, shut it down, reboot it, or open its console.
### Performance
Performance metrics for the host over a selectable time range.
### Profiles
The configuration profile applied to the host. If no profile is shown, the host inherits its cluster's configuration profile. Select **Manage** to open the **Config Profiles** page, where you can choose a cluster or host profile.
### Hardware
The host's hardware: physical and virtual disks, hardware and disk health, and physical network interfaces.
### Network
The host's network configuration. Select **Columns** to show, reorder, or resize the columns.
### Storage
The folders and files stored on the host. Use the **Actions** column to rename, copy, move, or delete them.
Files here can include VM disk images and platform-managed data. Moving or deleting a file that a VM depends on breaks that VM. Treat anything you did not create yourself as platform-managed.
### Updates
The history of system updates run on the host. Select **Run Update** to update this host.
Updating a host reboots it, which stops every VM running on it. Put the host into maintenance mode and migrate its VMs first, and confirm the remaining hosts have capacity to take them.
To upgrade every host in a cluster without taking workloads down, use a rolling upgrade from the cluster's **Updates** tab instead. See [Clusters](/director/compute/clusters#updates).
### Services
This tab has two sections:
* **Container Status** lists the platform services running on the host, with each service's state, the reason for that state, and its restart count. Select **Logs** to view a service's logs.
* **Host-level Overrides** lists the configuration overrides set on this host, whether each is active, and where it came from. Select **Preview** to view an override's details.
### Alerts
The host's alert history. Each alert shows its status (for example, `Resolved`), its severity (for example, `Warning` or `Critical`), and a message with more detail. Search alerts, filter them by status or severity, choose columns with **Columns**, and download them with **Export CSV**.
### Events
The host's event history. Each event shows its time, type, severity, source, and message. Search events, filter them by severity, choose columns with **Columns**, and download them with **Export CSV**.
### Logs
Logs from the Talos Director agents on the host. Select an agent log on the left to view it. Select **Following** to stream new entries as they arrive, and **Download** to save the selected log.
This documentation is built and hosted on [Mintlify](https://mintlify.com), a developer documentation platform.
* **Reboot**: reboots the selected hosts.
* **Power Off**: powers down the selected hosts.
* **Maintenance Mode**: puts the selected hosts into maintenance mode. The dialog that opens lets you live-migrate the hosts' VMs to other hosts in the cluster before maintenance mode begins.
* **Clear**: clears the selection.
Rebooting or powering off a host stops every VM running on it. To keep workloads running, put the host into maintenance mode and migrate its VMs first, and confirm the remaining hosts in the cluster have the capacity to take them.
## The host detail screen
Click a hostname to open its detail screen. Tabs separate each aspect of the host.
### Overview
High-level information about the host, including CPU and memory usage and system information.
### Virtual Machines
The virtual machines on the host, with each VM's power state, CPU count, and total capacity. From the **Actions** column you can power a VM on, shut it down, reboot it, or open its console.
### Performance
Performance metrics for the host over a selectable time range.
### Profiles
The configuration profile applied to the host. If no profile is shown, the host inherits its cluster's configuration profile. Select **Manage** to open the **Config Profiles** page, where you can choose a cluster or host profile.
### Hardware
The host's hardware: physical and virtual disks, hardware and disk health, and physical network interfaces.
### Network
The host's network configuration. Select **Columns** to show, reorder, or resize the columns.
### Storage
The folders and files stored on the host. Use the **Actions** column to rename, copy, move, or delete them.
Files here can include VM disk images and platform-managed data. Moving or deleting a file that a VM depends on breaks that VM. Treat anything you did not create yourself as platform-managed.
### Updates
The history of system updates run on the host. Select **Run Update** to update this host.
Updating a host reboots it, which stops every VM running on it. Put the host into maintenance mode and migrate its VMs first, and confirm the remaining hosts have capacity to take them.
To upgrade every host in a cluster without taking workloads down, use a rolling upgrade from the cluster's **Updates** tab instead. See [Clusters](/director/compute/clusters#updates).
### Services
This tab has two sections:
* **Container Status** lists the platform services running on the host, with each service's state, the reason for that state, and its restart count. Select **Logs** to view a service's logs.
* **Host-level Overrides** lists the configuration overrides set on this host, whether each is active, and where it came from. Select **Preview** to view an override's details.
### Alerts
The host's alert history. Each alert shows its status (for example, `Resolved`), its severity (for example, `Warning` or `Critical`), and a message with more detail. Search alerts, filter them by status or severity, choose columns with **Columns**, and download them with **Export CSV**.
### Events
The host's event history. Each event shows its time, type, severity, source, and message. Search events, filter them by severity, choose columns with **Columns**, and download them with **Export CSV**.
### Logs
Logs from the Talos Director agents on the host. Select an agent log on the left to view it. Select **Following** to stream new entries as they arrive, and **Download** to save the selected log.
This documentation is built and hosted on [Mintlify](https://mintlify.com), a developer documentation platform.